The Future is Now
We prepare leaders for an increasingly volatile world
Strategic Economic Issues
- Australia’s economy needs to be ‘match fit’ for a world of demographic change and rapid technological advances. Weak productivity, surging government spending and a rising tax burden are headwinds to growth, innovation and living standards.
- Inflation is the immediate risk for Australia’s economy. The latest CPI numbers show inflation back above the top of the RBA’s 2-3% target band and likely moving higher into 2026. As an economy, Australia is highly exposed to inflation through variable mortgage debt and unindexed income tax brackets. It is imperative that the RBA keeps inflation low and stable.
- Geopolitical uncertainty, digital innovation and labour shortages are the big issues we can’t ignore, with energy supply and an onerous regulatory burden significant headwinds to investment and business expansion.
- We are in a world where innovation and technological uptake will be the major factor determining our economic success. Chronic labour shortages mean we need get people into the most productive and purposeful jobs. Australian business, big and small, will lead the way.
The New Economy of the 2020s
- Demographics is destiny, and demographic change is disruptive. The focus for many economists and policymakers has been on slowing population growth and an ageing population. But the most profound demographic change for our economy is the turn in the dependency cycle, “the great demograpgic reversal”, as the great UK economist Charles Goodhart phrased it.
- After a half century of falling dependency, we are now have decades of rising dependency to contend with. We are at the beginning; but this new economy is emerging in front of our eyes. We have transitioned from a world of demand deficiency and unemployment to a new economy of excess demand and persistent upward pressure on labour costs and inflation. These are the macro outcomes, not well understood, and completely at odds with the economy we have known for deacdes. But it is the microeconomic processes running through markets and industry that are fundamentally changing the business operating environment.
- Japan was the first nation to pass through this long-term demographic turnng point. Foriegn direct investment and surging government spending characterised the Japanese approach to the great demographic reversal. Almost 20 years later the Japanese economy is vulnerable to shocks as government debt continues to climb towards 250% of GDP. The ‘Japan Route’ is not a viable option for Australia, but it could happen if government continues to grow it’s share of the economy, denying the market sector the resources and vitality needed to innovate.
- Utilising technology to enhance the existing labour supply or freeing up workers to move to human centred jobs, is the optimal path. The technology is coming online that can help all nations deal with these new demographic realities. Supercomputing and artifical intelligence will change everything over the decade ahead, and offer a world of high productivity, rising living standards and rapid innovation in everything from environmental managment to mental health.
- Our leaders must accept these new realities and manage the transition process to mininise the disruption to everyday lives and support those most impacted. To swim against this tide is to leave us all in a weaker position. As a general proposition, people resist change, not least our leaders. As a result, history is littered with sudden and severe economic crisis in the midst of these once in a century transformations. Reality eventually catches up with those that resist. Whether it be an economic slump of its own accord, or a surge of inflation and interest rates, these financial crisis rapidly reallocate our scacre labour and capital resources from the old to the new.
Chart of the Month

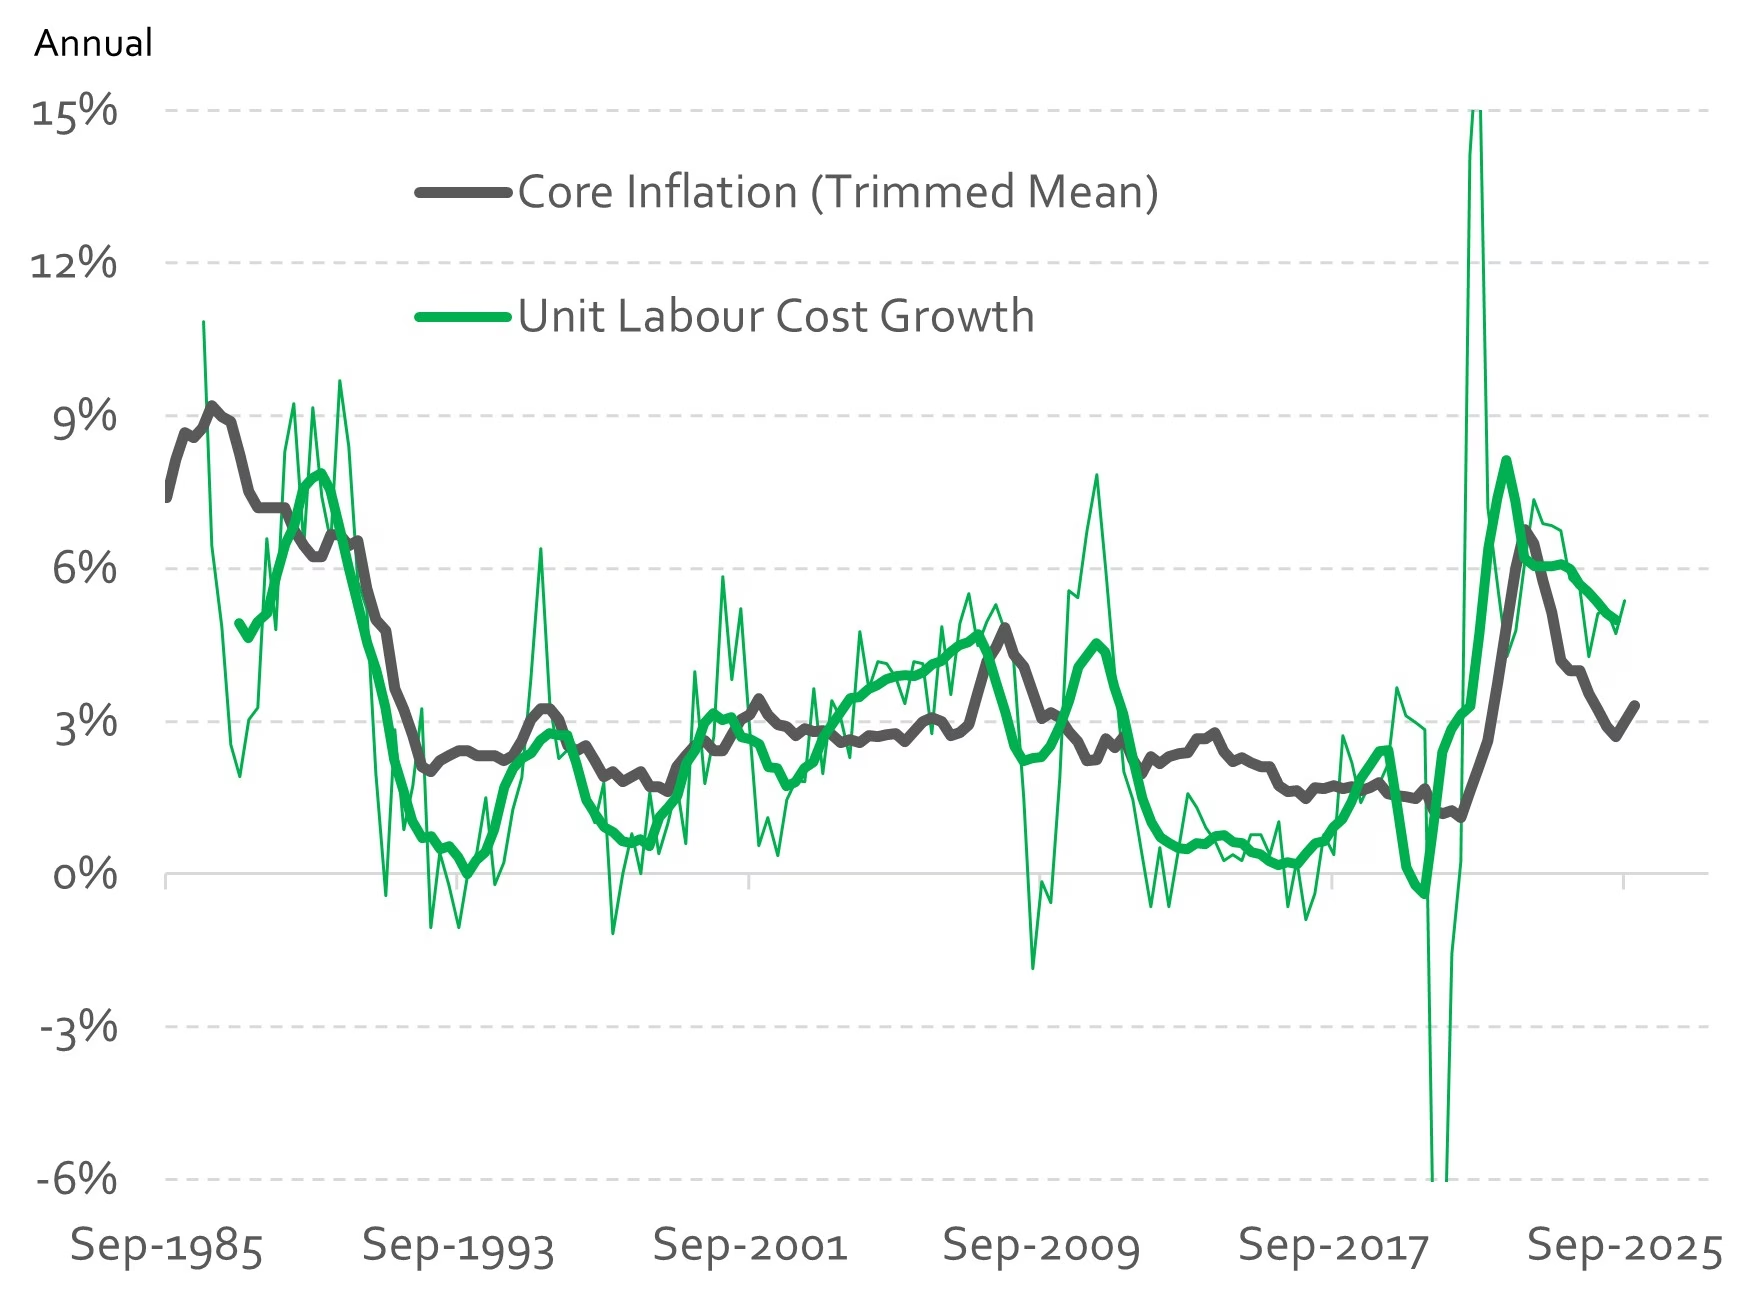
- Unit labour costs remain persistently high in late 2025
In the new economy of the 2020s structural labour shortages mean persistent upward pressure on labour costs. And that means persistent upward pressure on inflation - Australia’s cyclical economic recovery is well underway
For the RBA and interest rates this means we are entering an economic ‘danger zone’ where both cyclical and structural forces are putting upward pressure on business costs and inflation
Key Business Metric

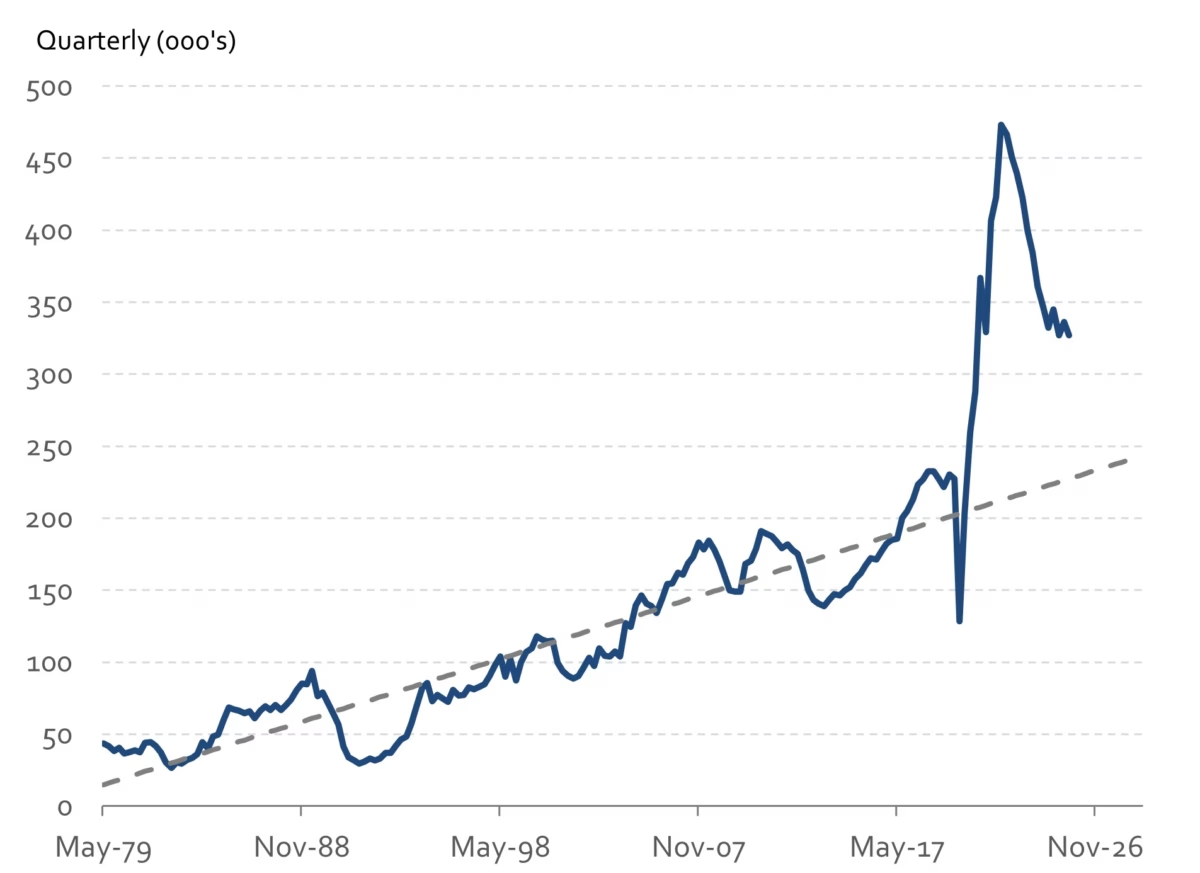
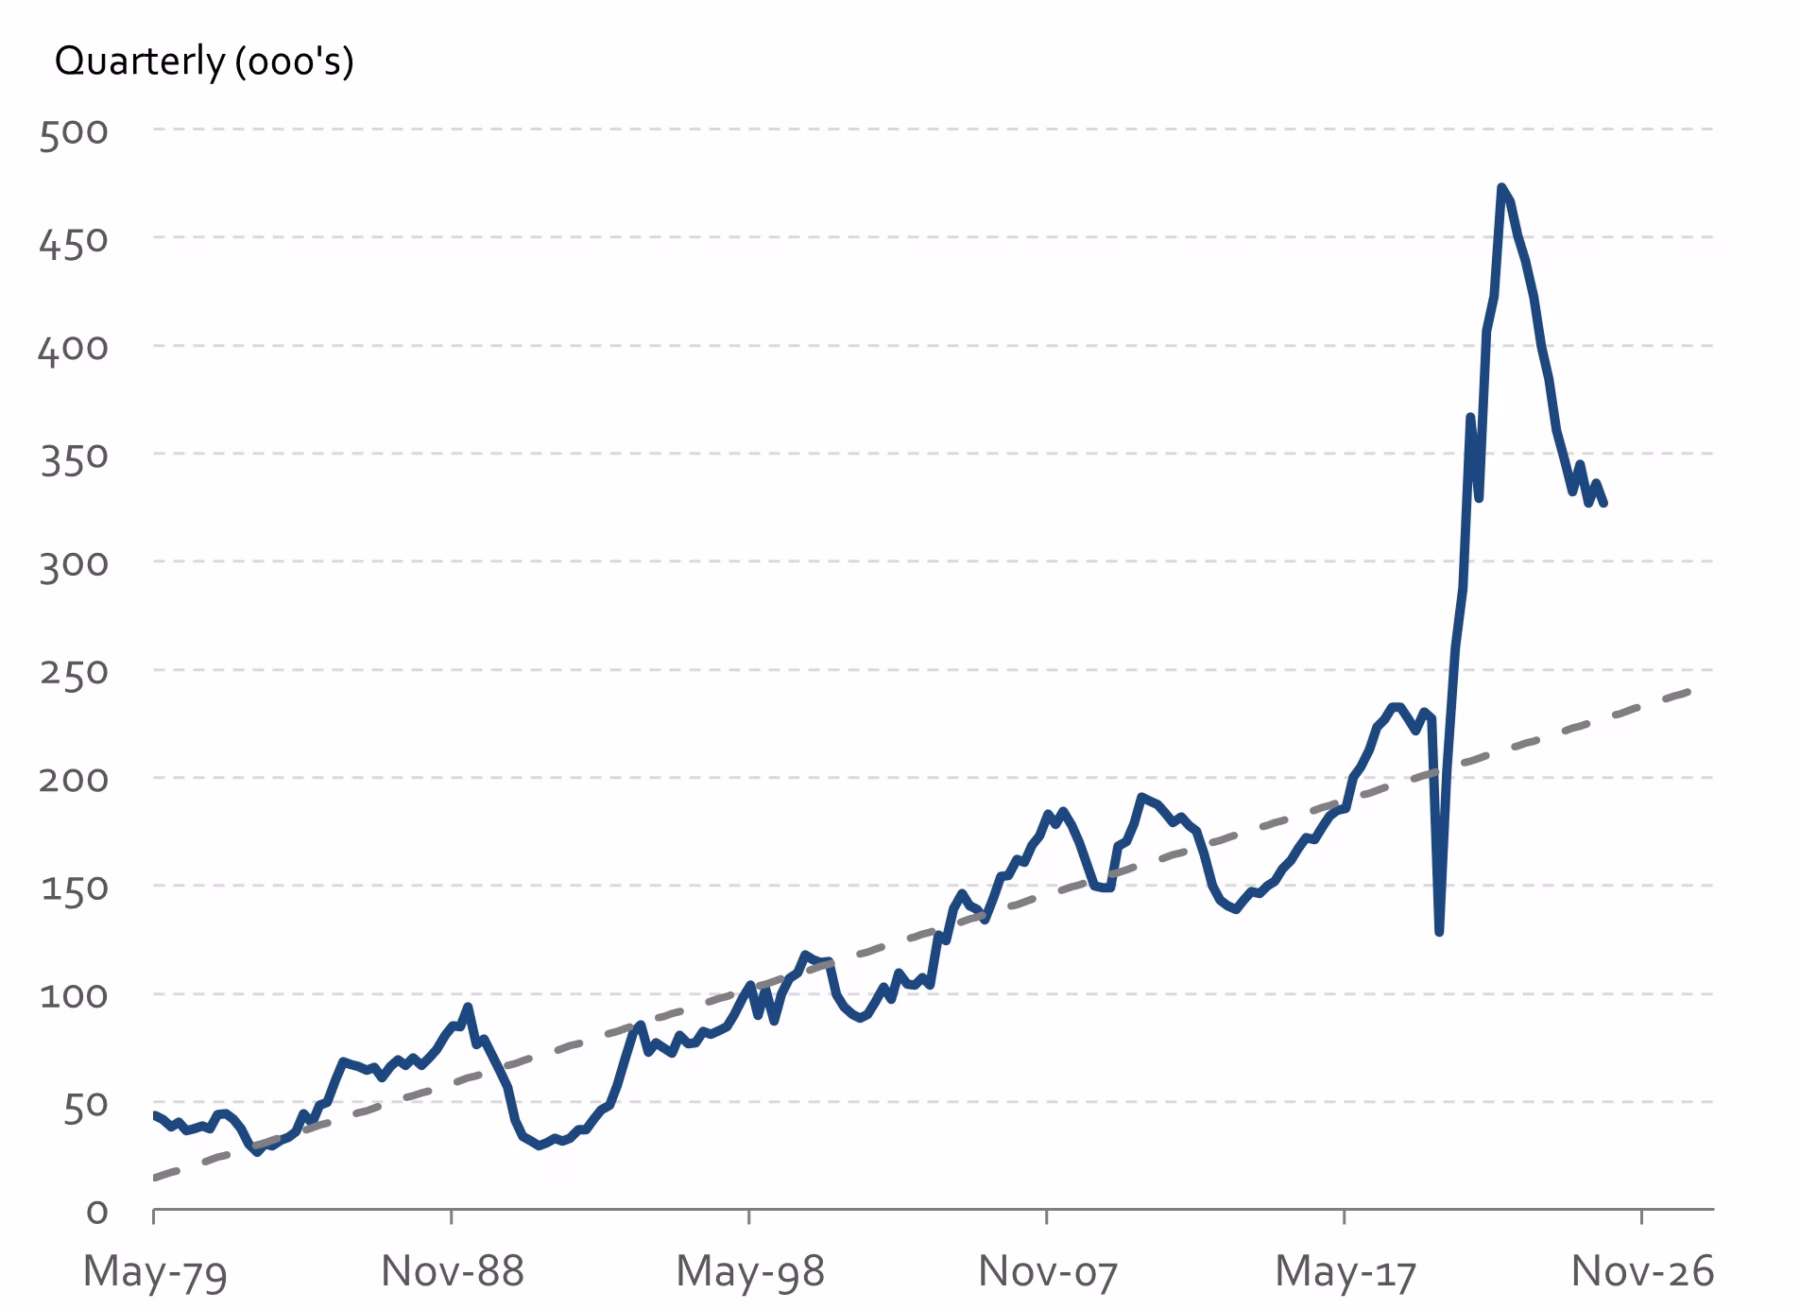
Job vacancies across the Australian economy remain well above the long-term trend despite having eased back from historically high levels seen in mid 2022. Job vacancies hit a high of 473,000 in 2022 and have since fallen back to around 323k. Vacancies have been stable for the past year reflecting labour demand that is going unfilled, we suspect due to skills mismatches but also simply becuase the overall level of labour demand in the economy is running above the effective supply of labour. Job Vacancies in mid 2025 were still 30% above the long-term trend line depicted in the chart. This chart, more than any, provides a clear picture of the demographically driven structural shift in our economy in recent years. The turn in the dependnecy cycle has taken Australia from an economy with an excess supply of labour through the 1980s right up to the pandemic (unemployment), to an economy now charactoerised by a shortage of labour. This is the most profound shift in our economy. It is this demographic shift which is the catalyst for so much change in the economic operating environment, from difficulty sourcing staff and rising labour costs while being a major force driving labour saving technological adoption.

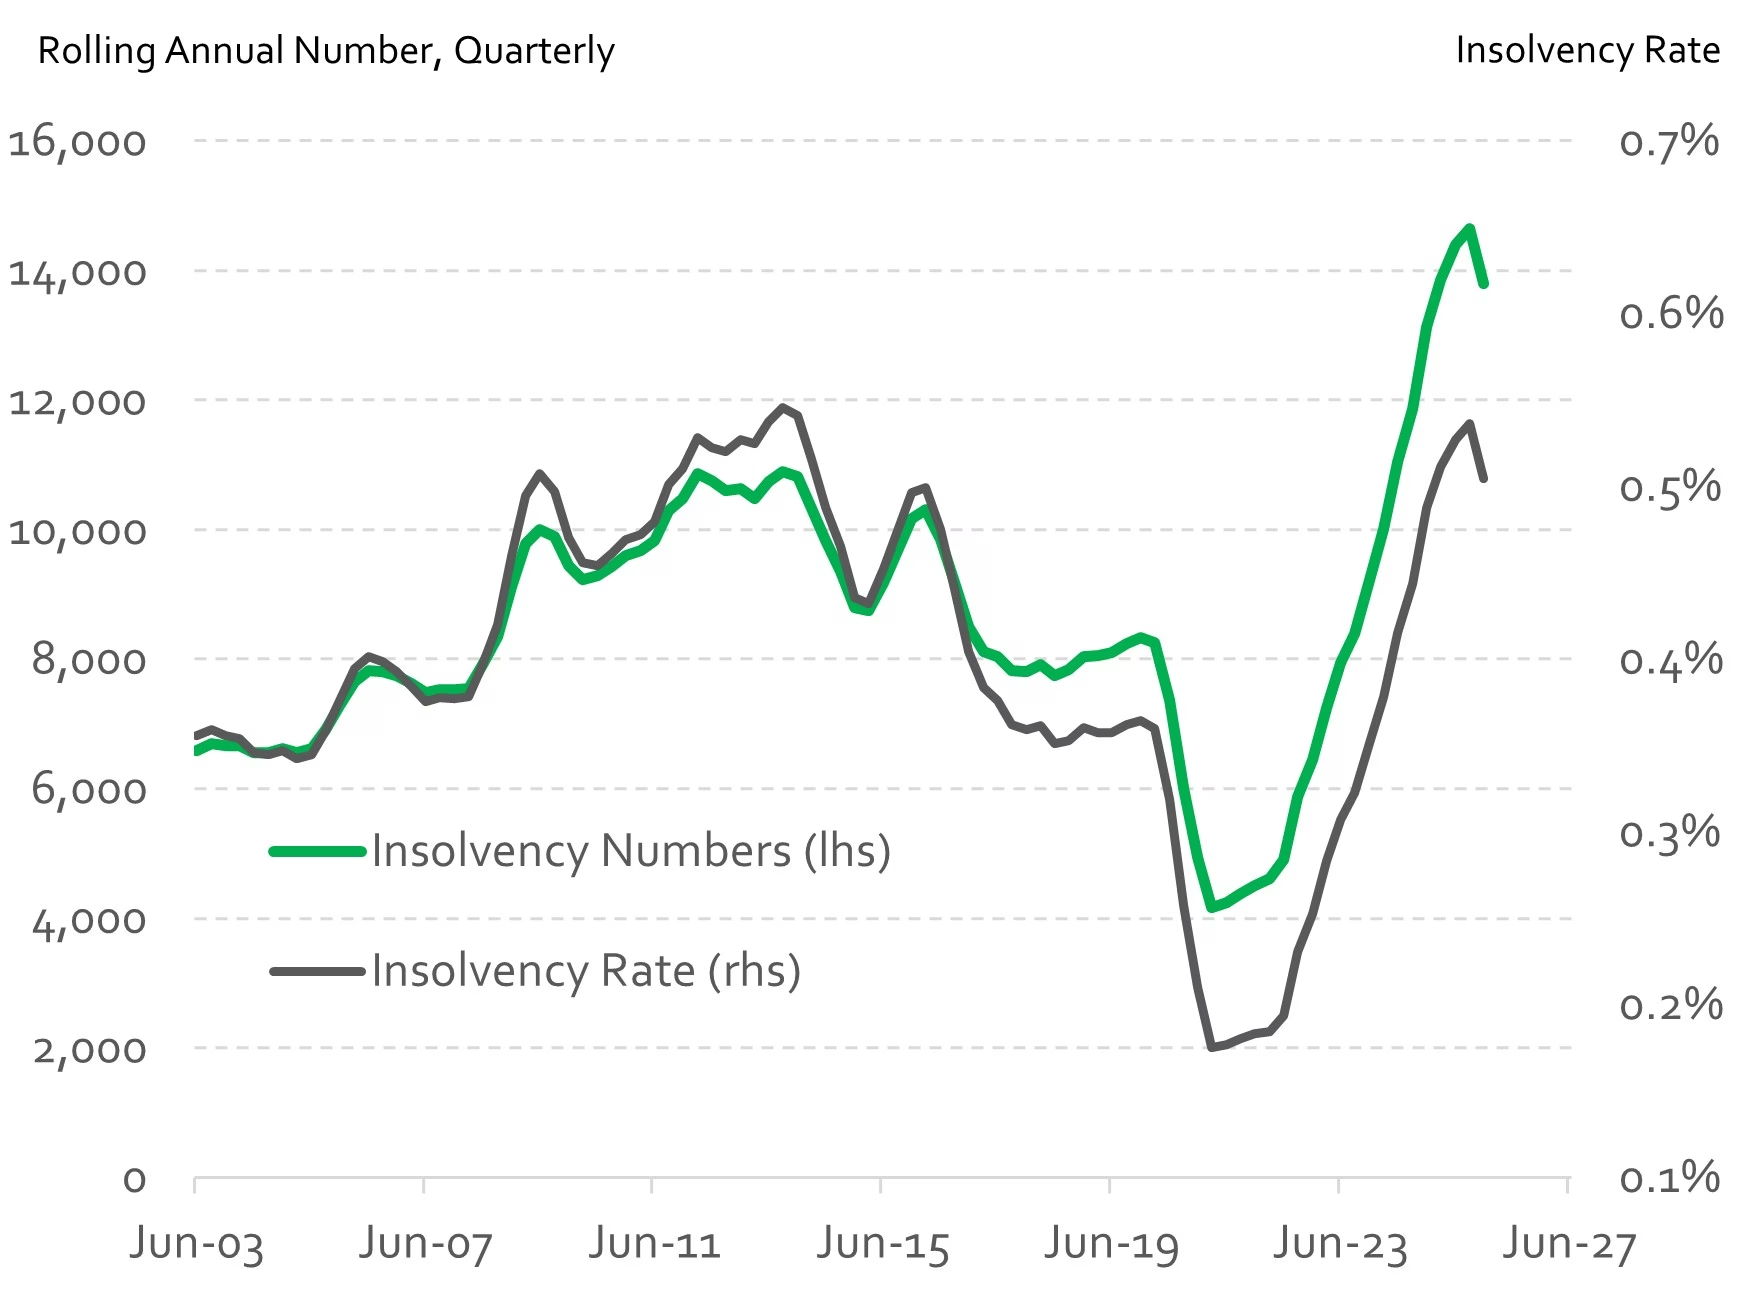
The rapid rise in business insolvency that commenced in 2022 appears to have eneded in 2025. The ASIC first time insolvency statistics show a stabilisation of business failures in 2025at an annual equvalent of just under 15,000. The insolvency rate (first time insolvencies as a share of the toal businesss count) has also stabilised just above 0.5% with signs of a decline in insolvency numbers and the insolvency rate in the final months of 2025. The number of business failures hit a record high in early 2025, well above the previous high point in 2013. The insolvency rate also matched that previous high. Insolvency trends can be explained by both cyclical and strucutral factors. The recent surge out of the pandemic may reflect the extended period of very low insolvencies over the prior decade. Similarly, the recent decline in insolvency numbers could reflect the improvement in business trading conditions in 2025. In an economy expected to experience a major transformation over the decade ahead we expect insolvency numbers to remain high, if not go higher. This will be matched by strong growth in business formation as technology and a changing economy encourage new players into a range of industries and markets.
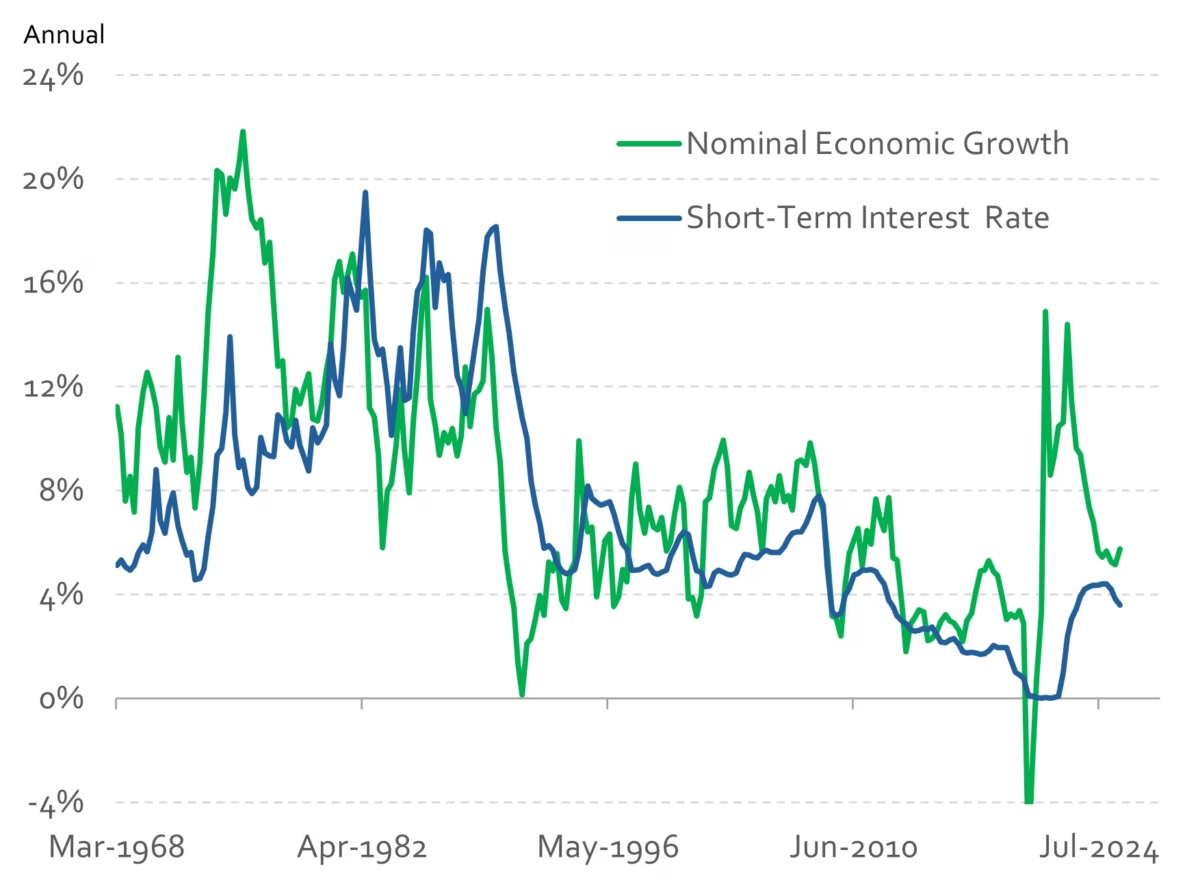
Australia has been running economic growth (not adjusted for inflation) well above the nominal interest rate for almost a decade, a traditional sign of ‘easy money’, that is, keeping the RBA cash rate too low. This did not lead to rising inflation prior to the pandemic but could be part of the reason inflation remains stubbornly high in 2025 as the global and domestic economic backdrop has structurally changed since over the past 5 years. The interest rate does not need to ‘match’ the nominal growth rate of the economy. Through the period of sustained economic and productivity growth in the 1990s and 2000s, the interest rate, on average was about 1% lower than nominal growth. Since 2015 this ‘gap’ has been about 3 percentage points. The last time Australia held the interest rate well below the nominal growth rate of the economy was in the 1970s, and that did not finish well. We ended up with persistent and high inflation which was only resolved in the 1980s with high interest rates (running above nominal growth), and ultiamtely a financial crisis and severe recession in the early 1990s. There is a very real risk that the RBA will need to get the cash rate up much higher than the current rate if we are to get inflation back down under 3%. There is also a genuine risk that inflation, after such a sustained period of ‘easy money’ over the past decade, starts to rise by much more than anyone is seriously considering right now. We all hope not.
EQ Workshops – Strategic Leadership in an Uncertain World
Let EQ Workshops prepare you for a volatile and uncertain business operating environment. In a world where the economic climate has become more challenging, EQ Economics commits to equipping leaders with the tools, insights and advice needed to adapt and thrive amid ongoing volatility and change.
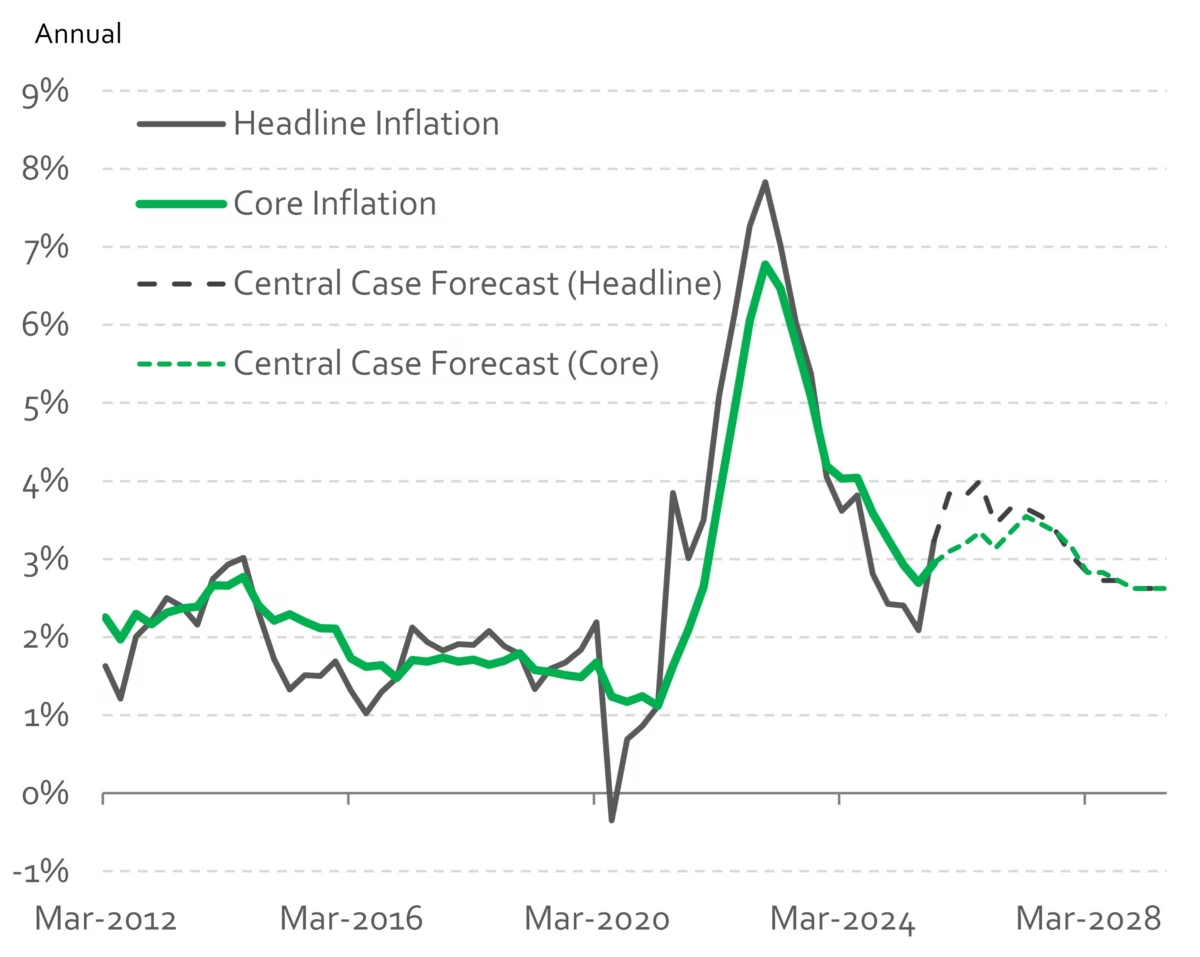
- Australian inflation jumped higher in the September quarter. Annual ‘headline’ inflation rate increased to 3.2% from 2.1% in June. This was a genuine surprise to markets and economists but highlights better trading conditions for Australian business that appear to have scope to pass on rising costs to final prices.
- Economists focus on ‘core inflation’, which is best measured by the Trimmed Mean measure of inflation. This measure strips out ‘noise’ to reflect underlying trends. Core inflation was up 1% in Q3, the highest since early 2024. The annual core inflation rate increased to 3% from 2.7% in June, the first increase in annual core inflation since 2022. All eleven major components of the CPI increased in the September quarter, the first time this has happened since 2022, highlighting the broad-based nature of current inflation pressures.
- This result was broadly in line with our assessment that inflation has not been contained, with risks skewed to higher inflation in 2026. The Q3 result confirmed our worst fears and has forced a widespread re-assessment of the inflation outlook.
- The immediate implication of the high inflation result is to rule out a further reduction of the RBA cash rate any time soon.
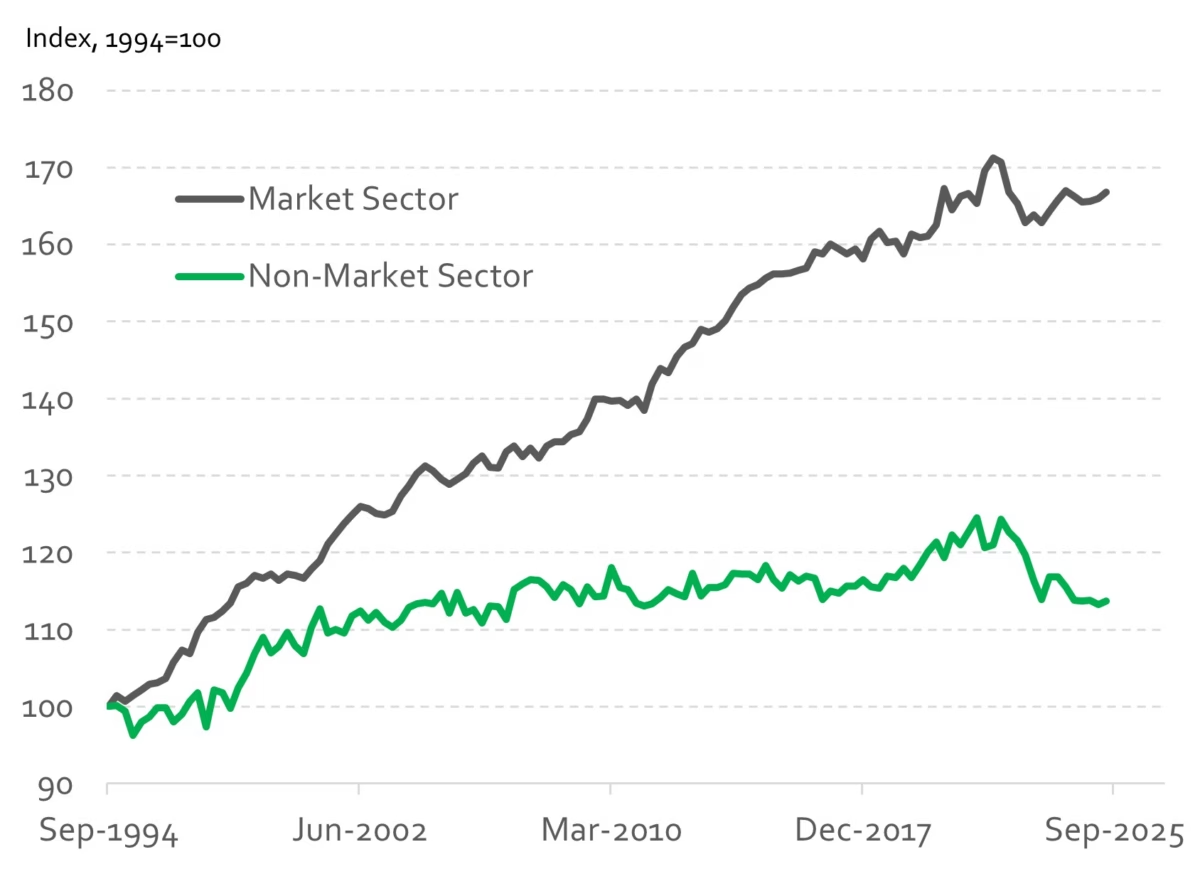
- The Australian Bureau of Statistics released estimates of market sector and non-market sector productivity. The non-market sector is the public service and private sector industry reliant on government funding . These new figures are both illuminating and shocking.
- Productivity at an aggregate level is not measured directly. It is calculated from data on output (industry value add) per unit of labour input (hours worked). The new data is indexed, and commences in September 1994 with an index level of 100.
- Non-market sector productivity in the June quarter of 2025 recorded an index level of 114. That is, over the last 30 years, public sector and government funded industry has seen a cumulative productivity increase of 14%, less than 0.5% growth per year on average. Over the last 30 years productivity growth of 1% per year would be regarded as OK in most advanced economies. Good productivity growth is considered to be 2% per year or higher.
- The market sector recorded a productivity index of 167 in June 2025, implying a 67% increase in productivity or just under 2% annual growth. This highlights a stark contrast between private business productivity, which mostly operate in competitive markets, and the public sector, where funding is mostly by governments.